Reports of 2039 Clear search Modify search
AdV-COM (AdV commissioning (1st part) )
mwas - 7:39 Tuesday 14 May 2024 (64245) Print this report
Optical gain changes due to recalibration

The optical gain reported in Hrec in the past few weeks is lower than what I remember it being in March.

Figure 1 shows the evolution of the optical gain over the past 6 months, color coded by the DCP frequency.

There have been gain drops, one around March 20, and two around April 8-10.

The April 8 change is due to change in the calibration of the B1 photodiodes in mW when updating blending filters https://logbook.virgo-gw.eu/virgo/?r=63886

The April 10 change is due to change in the actuator models used in Hrec https://logbook.virgo-gw.eu/virgo/?r=63919

And the change around March 20 is due to the change in working point for the DCP frequency from ~175Hz to ~190Hz.


Images attached to this report
Virgo Runs (O4b)
mwas - 21:24 Monday 13 May 2024 (64242) Print this report
Comment to Operator Report - Morning shift (64231)

When an unlock is likely to have been caused by an earth quake. It would be good to change the interferometer mode from PREPARE_SCIENCE to EARTHQUAKE for the duration of the relock. This will help with counting how many unlocks where likely due to an earth quake, and motivate what could be the benefit of commissioning to make the interferometer more resilient to earthquakes.

AdV-TCS (Ring Heater)
mwas - 15:42 Monday 13 May 2024 (64240) Print this report
Comment to RH power change-Step 1 (64216)

Figure 1 There has been no visible impact from the RH step on the amount of DARM signal on B1s (OMC rejection port demodulated at 491.3Hz).

Figure 2 There was much more oscillation on the B1s DARM signal, and this might be due to the etalon effect which after the longer maintenance and the few hours of measurement on Tuesday afternoon was oscillating more.

Images attached to this comment
Optical characterization (Optical characterization)
mwas - 12:31 Monday 13 May 2024 (64238) Print this report
Comment to Scan of the OMC in CARM_NULL_1F (64206)

Figure 1 tries to fit the scan calibrated into MHz, the scan is not well linear so it doesn't work perfectly well. The order 2 mode is crossed at least 4 times during the scan, these are the 4 peaks highlighted, two during the time the temperature is increasing and two during the time the temperature is decreasing. The order 2 mode varies between 19mW and 41mW using the same calibration factor for B1 PD3 of 4800.

/users/mwas/OMC/OMC_scan_demod_20240507/OMC_SCAN.m

Images attached to this comment
AdV-ISC (LSC Noise Budget)
mwas - 12:03 Monday 13 May 2024 (64237) Print this report
Comment to SSFS noise injections exciting violin modes of the arms mirrors (64230)

Notches are the best form of shaping for narrow resonant modes. Are there notches at the first harmonic (~900Hz) of the violin modes in the DARM and CARM corrections? I have some doubts that the laser frequency noise can directly excite violin modes. A contamination by frequency noise into the CARM and DARM correction seems more likely.

Virgo Runs (O4b)
cabrita, mwas - 10:55 Wednesday 08 May 2024 (64209) Print this report
Comment to Operator Report - Morning shift (64135)

We can apply the same logic to the B1p and B1s photodiodes to confirm whether they give similar results to those obtained with the phase camera.

In order to better compare, we can use the phase camera and also compute the sidebands dark port transfer function and calibrate their power at the dark port. The sum carrier + sidebands should give a similar value to the one given by the B1p and B1s photodiodes.

Figure 1. shows the calibrated phase camera powers (carrier and sidebands) after 1 hour of science mode (30th April).

Figure 2. shows a comparison of the phase camera calibrated power vs the calibrated B1p and B1s photodiode signals. For comparison the carrier only power and carrier + sbs signals are shown. The carrier + sbs power seems in agreement with the B1p PD2 and B1s PD1 photodiodes (B1p PD1 had weird results, maybe because of the shutter being on at some point).

Analysis of the OMC scans might show if the relative power between carrier and sidebands matches that seen by the phase camera.

Images attached to this comment
AdV-DET (Photodiodes air boxes and supports)
gouaty, mwas - 17:00 Tuesday 07 May 2024 (64203) Print this report
Comment to B1 PD1 shutter remained open (64183)

In order to try to mitigate this problem, we have increased the shutter pulse duration from 20 ms to 40 ms for both B1_PD1 and B1_PD2. The SDB2_dbox_bench process has been reloaded at 14h52m27-UTC.

AdV-ISC (Steady state longitudinal control conceptual design)
mwas - 10:32 Tuesday 07 May 2024 (64190) Print this report
Comment to RIN vs MICH/PRCL offset (64184)

Figure 1, the 157Hz bump decrease in the first hour of each lock, Figure 2 during the shift yesterday it did not decrease because the MICH SET loop was intentionally disable for an hour, and then MICH SET adjusted quickly by hand. 

Figure 3 confirms that RIN coupling due to a MICH offset is the dominant coupling path fo the 157Hz bump. Blue was with a large RIN coupling to DARM, red  and yellow are with the coupling intentionally increased by adding a MICH offset in the wrong direction, and green purple and green are with the MICH offset adjusted to minimize the RIN coupling (at 1.5kHz).

Figure 4. As seen benfore when the PRCL offset is adjusted to minimize the frequency to amplitude conversion on B2 (blue and red lines), the B2 Audio spectrum is much cleaner, especially at high frequency.

Figure 5 and 6 what is surprising is that looking at the B2 quadrants. In the vertical direction the coupling of frequency noise (227Hz line) decrease in the vertical direction by a factor few, but in the horizontal direction there is no significant change. Does that mean that the coupling has a significant contribution of HOM? Note that this is true only for B2 QD1, on B2 QD2 the line at 227Hz is not visible in neither the H nor V direction, at any of the times. And on both quadrant the sum channel sees the line clearly and decreases by a factor 10 when adjusting the PRCL offset.

/users/mwas/ISC/RINanalysis_20240506/analyseRIN.m

Images attached to this comment
AdV-ISC (Steady state longitudinal control conceptual design)
mwas - 20:39 Monday 06 May 2024 (64184) Print this report
RIN vs MICH/PRCL offset

Shift started with a couple of unlocks.

17:56 UTC turned off MICH SET loop (putting MICH_SET_CAL to zero)

MICH set loop had not converged, so PSTAB was not yet at zero.

18:00 UTC (5min) PRCL set = 8.0 to zero the frequency to amplitude conversion on B2.

18:06 UTC (5min) PRCL set = 8.0, MICH set = -5.0, to increase PSTAB to DARM coupling

18:13 UTC (5min) PRCL set = 0.0, MICH set = -5.0

18:23 UTC (5min) PRCL set = 0.0, MICH set = 12.0 to zero the PSTAB to DARM coupling

18:29 putting back MICH SET loop (cali at -100000)

Figure 1. I have noticed any changes in the sensitivity during this test, appart from the 157Hz bump getting smaller when changing the MICH set to zero the PSTAB to DARM coupling. To be checked more carrefully if MICH set is really the cause.

Figure 2. Summarizes the change in PRCL and MICH offset. A PRCL offset of 8 changes the PSTAB to DARM coupling by about the same amount as a change of MICH offset of 5.

https://git.ligo.org/virgo/commissioning/commissioning-tasks/-/issues/52

Images attached to this report
Comments to this report:
mwas - 10:32 Tuesday 07 May 2024 (64190) Print this report

Figure 1, the 157Hz bump decrease in the first hour of each lock, Figure 2 during the shift yesterday it did not decrease because the MICH SET loop was intentionally disable for an hour, and then MICH SET adjusted quickly by hand. 

Figure 3 confirms that RIN coupling due to a MICH offset is the dominant coupling path fo the 157Hz bump. Blue was with a large RIN coupling to DARM, red  and yellow are with the coupling intentionally increased by adding a MICH offset in the wrong direction, and green purple and green are with the MICH offset adjusted to minimize the RIN coupling (at 1.5kHz).

Figure 4. As seen benfore when the PRCL offset is adjusted to minimize the frequency to amplitude conversion on B2 (blue and red lines), the B2 Audio spectrum is much cleaner, especially at high frequency.

Figure 5 and 6 what is surprising is that looking at the B2 quadrants. In the vertical direction the coupling of frequency noise (227Hz line) decrease in the vertical direction by a factor few, but in the horizontal direction there is no significant change. Does that mean that the coupling has a significant contribution of HOM? Note that this is true only for B2 QD1, on B2 QD2 the line at 227Hz is not visible in neither the H nor V direction, at any of the times. And on both quadrant the sum channel sees the line clearly and decreases by a factor 10 when adjusting the PRCL offset.

/users/mwas/ISC/RINanalysis_20240506/analyseRIN.m

Images attached to this comment
AdV-DET (Photodiodes air boxes and supports)
mwas - 19:18 Monday 06 May 2024 (64183) Print this report
B1 PD1 shutter remained open

Today during the lock acquisition I have noticed that there was power on B1 PD1 while trying to lock the OMC.

Figure 1 shows fluctuation on B1 PD1 even though the voltage bias is off.

Pressing the close button of the shutter in vpm worked to close it, but before that I panicked and closed B1 PD3  and turned off its voltage bias instead. Which caused an unlock first as DET_MAIN has seen the B1 PD3 being turned off and put the interferometer in DOWN.

Maybe the B1 PD shutters are starting to be stuck again because the interferometer locks are becoming too long, and they are not open/closed often enough. We may need to add checks in the automation to check they are indeed closed.

Images attached to this report
Comments to this report:
gouaty, mwas - 17:00 Tuesday 07 May 2024 (64203) Print this report

In order to try to mitigate this problem, we have increased the shutter pulse duration from 20 ms to 40 ms for both B1_PD1 and B1_PD2. The SDB2_dbox_bench process has been reloaded at 14h52m27-UTC.

Detector Characterisation (Broadband noise)
mwas - 19:08 Monday 06 May 2024 (64182) Print this report
Comment to Range, optical gain and DCP (64180)

The DCP measurement is likely just a witness of something else changing.

Figure 1 shows the same as on Paolo's figure, the optical gain changes from 3e9 to 2.9e9 and the DCP frequency changes by ~5Hz.

Figure 2 shows the squeezing test of last week. The SR TY set point was changed intentionally by ~25Hz, and the optical gain changed from 3e9 to 2.85e9.

So the change in DCP that occured during the weekend could explain only ~30% of the change in optical gain.


Images attached to this comment
AdV-COM (AdV commissioning (1st part) )
mwas - 15:40 Friday 03 May 2024 (64164) Print this report
Comment to CARM SLOW (64162)

One of the reason for having a CARM SLOW control is the OMC. If there are fluctuations in CARM the OMC length needs to follow, and with higher CARM fluctuation the OMC lock RMS will become worse and increase the thermorefractive coupling. However, this is seems to be very far from limiting.

Figure 1 shows the current noise budget (May 3 early afternoon), and the magenta line is the OMC length noise projection. about a factor 100 below the sensitivity curve.

Figure 2 shows last night when the ground motion was large (and presumably CARM RMS worse), the OMC length noise projection is still about a factor 20 below the sensitivity curve.

Figure 3 before the reduction in the CARM SLOW loop gain the OMC length noise projection was so low that it did not show on the figure.

So my impression is that if needed the CARM SLOW loop gain could be reduced by another factor 2. But there might be other aspects of the interferometer than the OMC that require a low CARM RMS.

Images attached to this comment
Virgo Runs (O4b)
mwas - 7:55 Wednesday 01 May 2024 (64148) Print this report
Comment to Operator Report - Night shift (64147)

The unlock at 3:41 UTC could have been due to an earthquake. There was a seismic disturbance in both NEB and WEB at about that time.

Images attached to this comment
AdV-ISC (LSC Noise Budget)
mwas - 20:12 Tuesday 30 April 2024 (64145) Print this report
Comment to LSC noise injections results (64132)

Figure 1. The CARM noise injection caused SR to move by ~0.5urad, because it made the B1 photodiodes saturate. It needs to be understood how the CARM noise injection shape needs to be changed so it doesn't cause B1 saturations which will spoil the measurement.

Figure 2. Normal daily hrec calibration measurements (between 16:00 UTC and 16:10 UTC)  are no longer kicking the SR alignment.

Images attached to this comment
AdV-SBE (Minitowers)
bulten, was, bertolini, bersanetti, gouaty, arnaud - 10:47 Tuesday 30 April 2024 (64138) Print this report
DMS flags added to horizontal positions SBE benches
When the horizontal microsprings are adjusted, or maybe when other horizontal actions on the minitower benches are performed, the DMS system does not give a warning if the position is still far off the setpoint. This happened April 16, see logbook entry 64002 from Nicolas Arnaud. After discussions, we decided to add flags to the monitoring system; we had flags for the vertical position (-30that for the relative speeds for SNEB and SWEB with respect to the superattenuators, but this requires further study to see if there are cases that the relative speed between benches is high, but none of the flags (RMS actuator voltage, bench error signal) is already triggering.
AdV-ISC (Steady state longitudinal control conceptual design)
mwas - 11:10 Monday 29 April 2024 (64122) Print this report
Comment to PRCL offset scan and frequency noise coupling - task 12 (64109)

In 2017 the PRC was measured to have a wrong length by 3-4mm: https://logbook.virgo-gw.eu/virgo/?r=36884

I have checked in Optickle that mistuning the sideband frequency by a 2 kHz (which should be equivalent to a 4mm cavity length change), the sideband behavior becomes asymetric with PRCL offset. WIth the sideband power increasing by 1-2% in one direction and decreasing by 1-2% in the other direction, when changing the PRCL offset by ~0.2nm. This is similar to the measurements done last Friday, but it disagrees with the PRCL calibration done a year ago: https://logbook.virgo-gw.eu/virgo/?r=36884. That calibration would say that the PRCL offset was changed by 1.5nm, which would make the sideband power change by a few tens of percent. Maybe that calibration is no longer valid, as some normalizing factors could have been changed when chaning PRCL error signal from 8MHz to 6MHz sideband, or when installing the RAMS on the 6MHz.

Figure 1 shows in red the normal situation, in blue with the frequency to amplitude noise coupling divided by ~2 by adding the PRCL offset and in purple by adding the PRCL offset which zeros the coupling. The power fluctuation on B2 at ~1.5Hz improve by a factor 10 when reducing the coupling, on B4 there is also an improvement by a factor ~3, while on B4 12MHz the situation becomes worse, with fluctuations increasing by a factor 2. That would make sense if we improve the resonance condition for the carrier and degrade for the 6MHz sideband.

Figure 2 are the same times but with colors not in the same order. It includes also the B7 and B8 powers, and while on B8 the improvement is monotonic when improving the frequency to amplitude noise conversion, on B7 it is not the case. Is that a consequence of one arm being 3cm shorter than the other?

Lets assume that the PRC length is wrong by ~3mm, there are several options to resolve this:

  1. Move PR by 3mm, which then requires retuning the input beam mode matching as it will change the input beam mode matching by one or a few percent
  2. Change the sideband frequency by ~2kHz, but that would require moving the IMC end mirror by ~5cm to follow, so it is not a viable option
  3. Move the input mirror by 3mm and maybe  also the end mirrors to keep the arm length the same. It might be the easiest to do and is the most reversible. It will also change the SRC length, but we have no measurements whether the SRC length is right or wrong, and it should be less critical because of the low finesse of the SRC.
Images attached to this comment
Detector Characterisation (Glitches)
mwas - 10:38 Monday 29 April 2024 (64129) Print this report
Comment to New numerous glitches starting last night (64114)

Glitches might have stopped because the WI etalon loop error signal has finally become negative. The loop is asking for cooling the WI tower, which means turning the heating belt off. This switch off didn't happen immediately, but with an on/off for 10 minutes, so it is most likely due to the loop itself and not from an intentional switch off.

Images attached to this comment
Detector Characterisation (Glitches)
mwas - 13:03 Sunday 28 April 2024 (64120) Print this report
Comment to New numerous glitches starting last night (64114)

Nice find. Figure 1 and 2 made using omicron-plot show that these glitches in the WI MAG started at the same time as the glitches in h(t) around 20:00 UTC, and that they have not been happening the day before, and have been happening since then. There are magnetic glitches between 150Hz and 200Hz that have stopped a few hours before the glitches at ~30Hz started. The two might be related.

Figure 3 shows that this glitches are not visible on the NI MAG. So it is likely that the issue is close to the WI.

Next steps should be:

  • Use the veto based on the WI MAG channel between 10Hz and 40Hz for GW analysis
  • Try to find the source of the WI MAG glitches. Is there a piece of hardware that is starting to fail near WI
Images attached to this comment
Detector Characterisation (Glitches)
mwas - 8:33 Saturday 27 April 2024 (64114) Print this report
New numerous glitches starting last night

Figure 1. From about 20:00 UTC yesterday there are many glitches in h(t) around 30Hz. The glitches between 18:00-19:00 UTC are normal, these are due to injections to measure coupling to h(t) of various of degree of freedom. What happens starting from ~20:00 UTC is in science mode, and needs understanding.

Figure 2 The SNR of these glitches has grown from ~15 to ~30 over 1 hour, and has been relatively steady since then. There were several unlocks since the problem started and the glitches have continued at the same SNR after the relocks.

Images attached to this report
Comments to this report:
narnaud - 10:04 Sunday 28 April 2024 (64119) Print this report

UPV + VetoPerf point to the following channels (without the _0 which is added in UPV to label the corresponding veto):

V0 → V1:ENV_WI_MAG_W_0, vetoed clusters: 454 (80.927 %)
V1 → V1:ENV_WI_MAG_N_0, vetoed clusters: 452 (80.570 %)
V2 → V1:ENV_WI_MAG_V_0, vetoed clusters: 452 (80.570 %)
V3 → V1:TCS_WI_CO2_ISSIN_0, vetoed clusters: 172 (30.660 %)
V4 → V1:ENV_CEB_ELECTRIC_0, vetoed clusters: 121 (21.569 %)

See https://scientists.virgo-gw.eu/DataAnalysis/DetCharDev/users/narnaud/UPV/20240428_glitches/V1:Hrec_hoft_16384Hz/perf/vp.html#V0 -> Click here to expand -> Time-frequency trigger distribution:    before/after veto.

In attachment the Omicron plots of h(t) and V1:ENV_WI_MAG_W, for comparison.


Images attached to this comment
mwas - 13:03 Sunday 28 April 2024 (64120) Print this report

Nice find. Figure 1 and 2 made using omicron-plot show that these glitches in the WI MAG started at the same time as the glitches in h(t) around 20:00 UTC, and that they have not been happening the day before, and have been happening since then. There are magnetic glitches between 150Hz and 200Hz that have stopped a few hours before the glitches at ~30Hz started. The two might be related.

Figure 3 shows that this glitches are not visible on the NI MAG. So it is likely that the issue is close to the WI.

Next steps should be:

  • Use the veto based on the WI MAG channel between 10Hz and 40Hz for GW analysis
  • Try to find the source of the WI MAG glitches. Is there a piece of hardware that is starting to fail near WI
Images attached to this comment
direnzo - 23:33 Sunday 28 April 2024 (64124) Print this report

These new glitches seem to originate from some noise source activating for ~2 minutes and off for ~4, similar to a square wave.

First of all, I identified the new glitch family selecting the omicron triggers with peak frequency lower than 40 Hz and SNR between 15 and 60. Then, plotting the temporal distances in the occurrences of consecutive glitches (similarly to what has been done for the 25-minute glitches), I noticed that these alternate between ~115 seconds and 250 or 225 seconds in the examined time interval: figure 1.

Figure 2 and 3 show the spectrograms of two consecutive glitches in hrec, and their whiten time series. The latter show opposite behaviours, with a spike up in one glitch, followed by a spike down in the next one.

Similar plots for the magnetometers at the West Input, show a step-like behaviour: figure 4 and 5.

The (non-whitened) time series of this magnetometer channel shows more clearly the square wave behaviour in the correspondence of each pair of glitches: figure 6.

The next task is finding what source is activating with a similar timing.


Images attached to this comment
swinkels - 8:34 Monday 29 April 2024 (64126) Print this report
The on-off pattern of the glitches sounds very similar to something we saw 4 years ago. This was eventually traced to one of the power supplies that drives the heating belt for the etalon control, which periodically went into thermal overload and shut itself down. Plotting the same signals as then, it seems we indeed have the same problem again.
Images attached to this comment
fiori, tringali - 10:09 Monday 29 April 2024 (64128) Print this report

Glitches disappeared around 6:45 UTC. Has some action been taken? Indeed, square waves were seen also in the CEB UPS CURR T monitor, as for the old problem with WI heating belts that Bas pointed out.

Images attached to this comment
direnzo - 10:35 Monday 29 April 2024 (64127) Print this report

I have run a cross-correlation analysis using deltas for each glitch time, and all the _mean and _rms channels from the trend frame. I confirm what was highlighted by Bas in the previous comment:

1) Since April 26 20:00 UTC, the LSC_WI_HB_moni channel has started behaving oddly, with a sequence of square waves from zero to the set point. This is simultaneous with the appearance of the new glitches. The channel monitoring the electric potential, LSC_WI_HB_cmd_100Hz_FS, doesn't present similar behaviour. Figure 1 shows the glitchgram, with the new glitches showing up at the end of Apr 26, and the time series of the two channels monitoring the WI etalon.

2) The glitches in hrec are synchronous with the steps in the square wave visible in LSC_WI_HB_moni.

3) The correlation analysis with the _rms and the _mean trend channels has produced no other correlated channel with these glitches.

Images attached to this comment
mwas - 10:38 Monday 29 April 2024 (64129) Print this report

Glitches might have stopped because the WI etalon loop error signal has finally become negative. The loop is asking for cooling the WI tower, which means turning the heating belt off. This switch off didn't happen immediately, but with an on/off for 10 minutes, so it is most likely due to the loop itself and not from an intentional switch off.

Images attached to this comment
dattilo, cavalieri - 11:35 Tuesday 30 April 2024 (64139) Print this report
As a follow up of the recent investigations on the WI etalon problem, we made a check of the WI heating belt power supply.
At around 08:30 UTC we went in TCS room where the power supply is located, and also looking at its analog display, we saw that it was delivering intermittently, as indicated by the LSC_WI_HB_moni signal.
We replaced the power supply with a spare one of the same kind (Kert 420). During the replacement (from 08:34 to 08:40 UTC) the operator temporarily opened the WI etalon loop, as recommended by Maddalena.
Now the loop seems working regularly (attached fig).
Images attached to this comment
AdV-ISC (Steady state longitudinal control conceptual design)
mwas - 20:28 Friday 26 April 2024 (64109) Print this report
PRCL offset scan and frequency noise coupling - task 12

Doing a PRCL offset scan to minimize the frequency to amplitude coupling at the input of the interferometer: https://git.ligo.org/virgo/commissioning/commissioning-tasks/-/issues/12

Starting after the calibration measurements between 16:00 and 16:15 UTC. The steps are done at a speed of ~1 unit of PRCL per 20 second.

16:22 UTC (5min) PRCL_SET = 1.0
16:28 UTC (5min) PRCL_SET = 2.0
16:35 UTC (5min) PRCL_SET = 4.0
16:42 UTC (5min) PRCL_SET = 6.0
16:51 UTC (5min) PRCL_SET = 0.0
17:00 UTC (5min) PRCL_SET = 6.5
17:07 UTC (5min) PRCL_SET = 6.2
17:16 UTC (5min) PRCL_SET = 12 - interupted by unlock just after 17:18:40 UTC

just after reaching LN3

18:10 UTC (5min) PRCL_SET = -6.0
18:17 UTC (5min) PRCL_SET = 0.0

Figure 1 summarizes the scan done up to the unlock, PRCL_SET ~ 6 correspond to zeroing the frequency to amplitude conversion by the interferometer as seen on B2. It also shows that adding the offset in PRCL reduces the 6MHz gain as seen on B4 12MHz by 2%.

Figure 2 compares the time with the frequency noise coupling to minimized (blue) to the normal situation (purple). The B2 noise is 10 times lower between 1Hz and 3Hz, and it is also lower above 1kHz where the frequency noise is dominant. In between B2 is dominated by the pole at ~500Hz noise, subtracting it using B5 or B4 could reveal more clearly the improvement in coupling of frequency noise to B2 at other frequencies. There is no wideband impact on the h(t) noise.

Figure 3, 4, 5 show that the frequency noise lines (227Hz, 1111Hz and 3345Hz) are a factor ~30 lower on B2, and about a factor 2 lower in h(t).

Figure 6  my impression is that the coupling of frequency noise to h(t) becomes lower because for SSFS_LF the I and Q quadratures become more overlapped, so the BS TY minimizes both at the same time, and for SSFS_LINE the I and Q quadratures (that are very correlated), become of equal magnitude but opposite sign.

I wonder what it means that the frequency to amplitude noise coupling is zeroed, while the sideband gain decreases. Does it mean that the sidebands are not well tuned to the length of PRCL, and we need to choose to have carrier well resonant or sidebands well resonant?

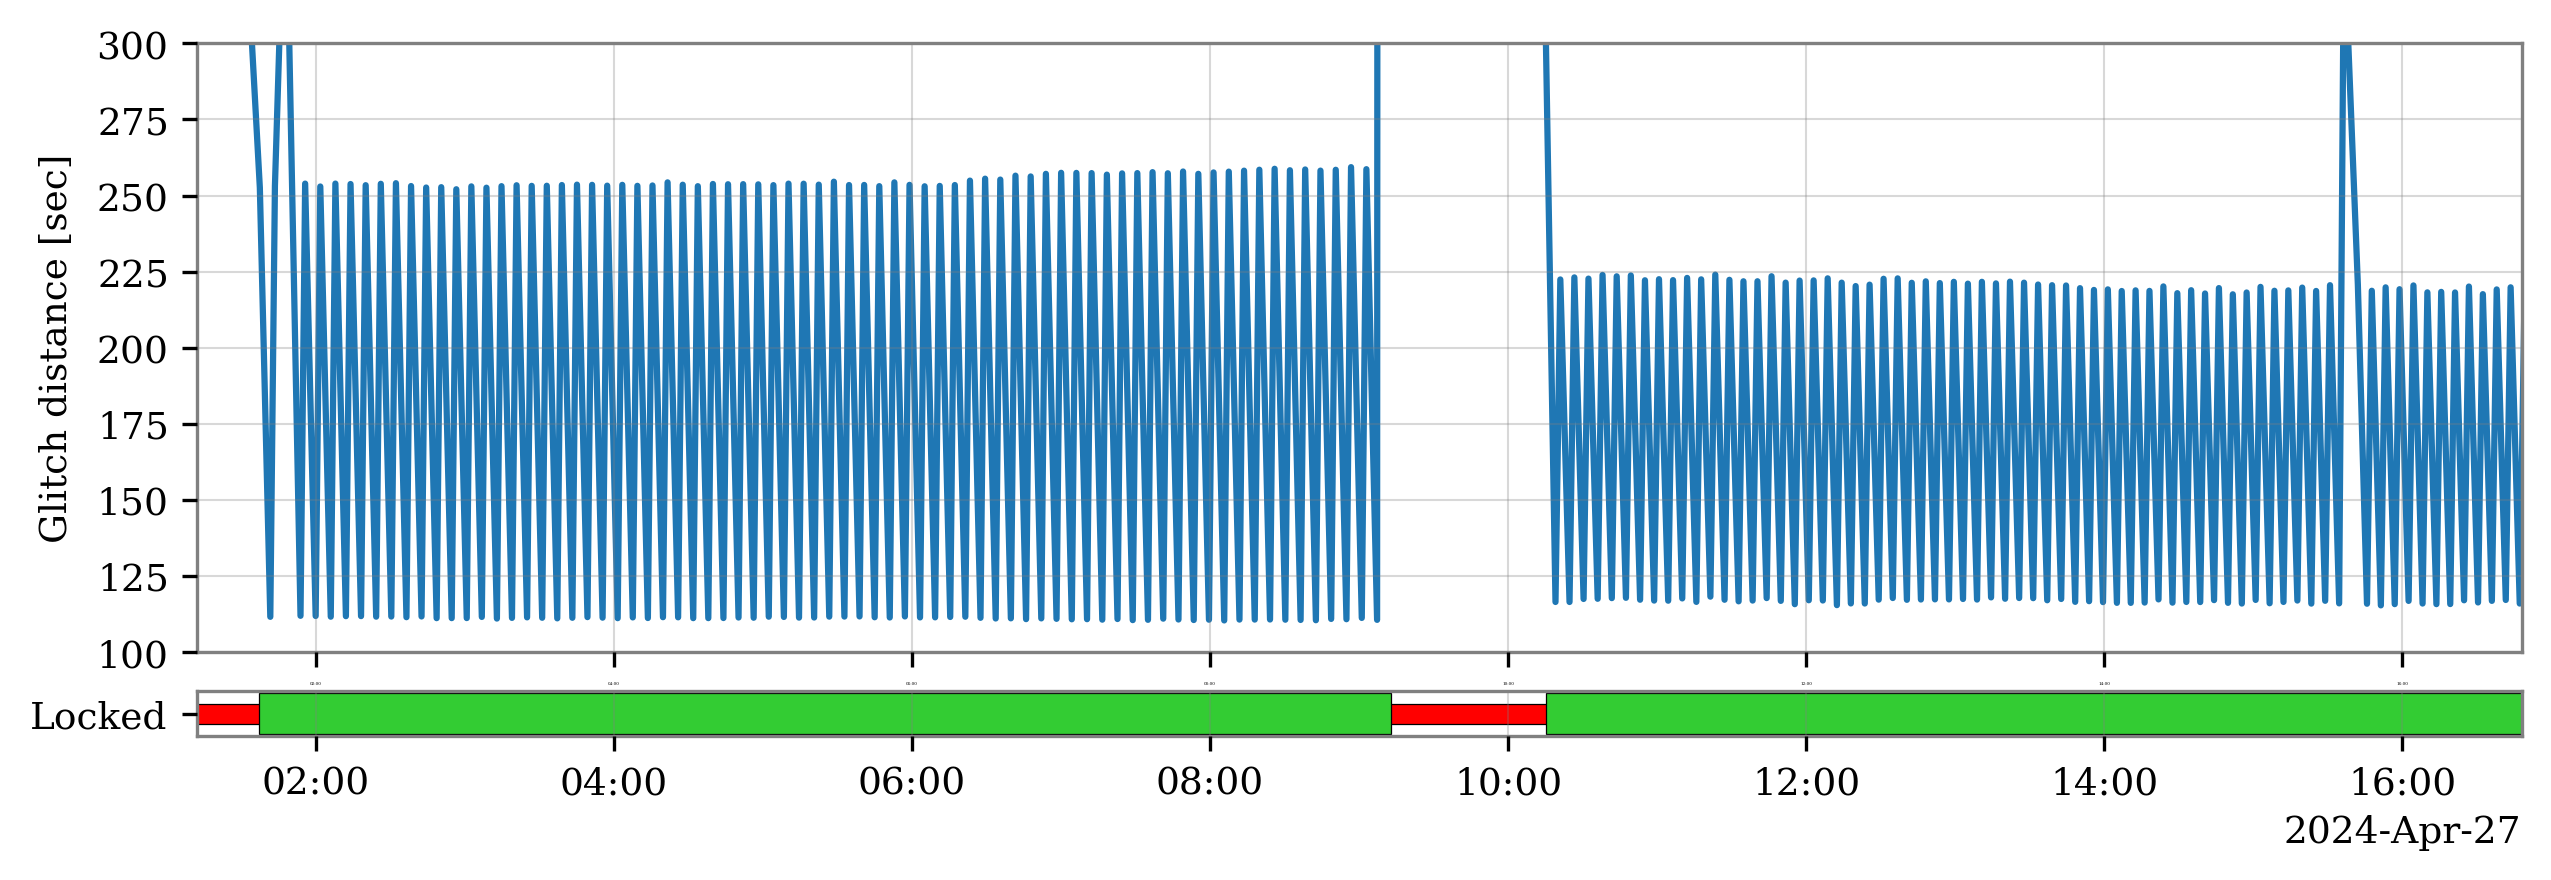
Figure 7 the coupling of frequency noise to B2 has been quite stable since the beginning of the run

Figure 8 shows the PRCL offset scan done just after the unlock. This scan went with the same magnitude but in the wrong direction for the frequency to B2 noise coupling, and this time it increased the B4 12MHz mag signal by ~1.3%. So it points towards the current working point being in between being good for sideband gain and being good for the frequency to amplitude coupling at the interferometer input. That would intuitively make sense if the sideband frequency doesn't match the PRCL length, and the RF error signal that is the between sideband and carrier finds a working point in between being good for the carrier and for the sideband.

Images attached to this report
Comments to this report:
mwas - 11:10 Monday 29 April 2024 (64122) Print this report

In 2017 the PRC was measured to have a wrong length by 3-4mm: https://logbook.virgo-gw.eu/virgo/?r=36884

I have checked in Optickle that mistuning the sideband frequency by a 2 kHz (which should be equivalent to a 4mm cavity length change), the sideband behavior becomes asymetric with PRCL offset. WIth the sideband power increasing by 1-2% in one direction and decreasing by 1-2% in the other direction, when changing the PRCL offset by ~0.2nm. This is similar to the measurements done last Friday, but it disagrees with the PRCL calibration done a year ago: https://logbook.virgo-gw.eu/virgo/?r=36884. That calibration would say that the PRCL offset was changed by 1.5nm, which would make the sideband power change by a few tens of percent. Maybe that calibration is no longer valid, as some normalizing factors could have been changed when chaning PRCL error signal from 8MHz to 6MHz sideband, or when installing the RAMS on the 6MHz.

Figure 1 shows in red the normal situation, in blue with the frequency to amplitude noise coupling divided by ~2 by adding the PRCL offset and in purple by adding the PRCL offset which zeros the coupling. The power fluctuation on B2 at ~1.5Hz improve by a factor 10 when reducing the coupling, on B4 there is also an improvement by a factor ~3, while on B4 12MHz the situation becomes worse, with fluctuations increasing by a factor 2. That would make sense if we improve the resonance condition for the carrier and degrade for the 6MHz sideband.

Figure 2 are the same times but with colors not in the same order. It includes also the B7 and B8 powers, and while on B8 the improvement is monotonic when improving the frequency to amplitude noise conversion, on B7 it is not the case. Is that a consequence of one arm being 3cm shorter than the other?

Lets assume that the PRC length is wrong by ~3mm, there are several options to resolve this:

  1. Move PR by 3mm, which then requires retuning the input beam mode matching as it will change the input beam mode matching by one or a few percent
  2. Change the sideband frequency by ~2kHz, but that would require moving the IMC end mirror by ~5cm to follow, so it is not a viable option
  3. Move the input mirror by 3mm and maybe  also the end mirrors to keep the arm length the same. It might be the easiest to do and is the most reversible. It will also change the SRC length, but we have no measurements whether the SRC length is right or wrong, and it should be less critical because of the low finesse of the SRC.
Images attached to this comment
AdV-COM (1/√f noise)
mwas - 15:32 Thursday 25 April 2024 (64100) Print this report
BS optical response vs SR alignment

A question is if the optical gain for differential signals created inside the CITF is different from the DARM optical gain as a function of SR alignment. The 56MHz optical gain which involves being recycled by SR is not affected by the SR misaligment, because the ~1.5urad SR misalignment is small compared to the ~12m length of the CITF, and the CITF is marginally stable. Is it the same for differential perturbations created by the BS?

Figure 1 shows a lock acqusition, with SR aligned at the beginning (pole at 400Hz) and then 10 minutes later misaligned (pole at 200Hz)

Figure 2 shows three times, 21:10 UTC with SR still aligned (purple), 21:20 UTC with SR misaligned (red), 21:30 UTC with SR aligned (blue)

Figure 3 zooms on the BS drum mode (1872Hz VIR-0476A-16 https://tds.virgo-gw.eu/?content=3&r=12696). It is decreasing over the 10 minutes of SR misalignment, but then in the following 10 minutes is decreases again by the same fraction in h(t). Hence this decrease is not a change in optical gain, but just the drum mode damping. Meanwhile on B1 the first step is clearly larger, as the optical gain at high frequency changes due to the SR misalignment. So it seems the optical gain evolves the same way as the DARM gain. And there is no strange effect that the SR recycling work differently for perturbations created in the CITF and perturbations created in the arms.


Images attached to this report
AdV-DET (Optical, mechanical and electronic components for benches (optics and camera mounts, fast shutter, motors,..))
mwas, carbognani - 11:13 Tuesday 23 April 2024 (64070) Print this report
OMC slow shutter driver replacement

Today between 8:00 UTC and 9:00 UTC we have done two tests to investigate the issue of the OMC slow shutter with a broken stop.

Stop and start the driver. This did not resolve the issue, the shutter when opening still runs without stopping when arriving to the end. We have stopped it manually after 1 minute.

Replace the driver with a spare, serial number FT4ZNKQD. The configuration of the rotation process was updated with the new serial number. The issue remained the same. The translation stage of the shutter still doesn't stop when closing.

All these actions were performed with DET_MAIN in pause and the interferometer in single bounce.

In conclusion the driver is not the issue, and probably the in-vacuum translation stage has one of the two stops that is broken.

Detector Characterisation (Glitches)
mwas - 8:16 Friday 19 April 2024 (64026) Print this report
Comment to Scattered light glitches after EIB control improvements (64022)

This is very interesting. My interpretation of to these results is:

  • The work on improving the EIB control has been effective. The scattered light glitches that its motion produces during bad weather is at frequencies below 20Hz, and maybe even 15Hz, which will be more difficult to improve on.
  • The main source of scattered light glitches 30Hz-50Hz during bad weather comes from the west end building. The WE suspension local control signal Sa_WE_F0_X_500Hz, may mean the suspension is moving, or that the ground around the suspension is moving. A more detailed analysis of all the position sensors in the WE building is needed to determine what is the source of scattered light in the WE building, but it is unlikely to be the mirror itself.
AdV-DET (Commissioning)
gouaty, masserot, mwas - 17:57 Thursday 18 April 2024 (64021) Print this report
OMC shutter opening: new command to avoid getting stuck at the end range

This afternoon we performed a few tests on the OMC shutter with the ITF in NI single bounce in order to find a solution to the problem of OMC shutter getting stuck at the opening.

Fig.1 shows a test when sent a MOVETOLIMIT command via VPM to open the shutter. In this case the shutter motor get stuck, and we stopped it by sending the STOP MOTION command.

We have tested the opening of the shutter by sending some MOVEREL commands with a defined number of steps. We have found that with about 36000 steps the power on B1s reaches a plateau. Adding a bit of margin, we decided to perform 42000 steps to open the shutter. This is tested on Fig.2. We can see that it takes about 65 seconds to accomplish this motion.

We have then replaced the MOVETOLIMIT command by the MOVEREL command for the opening of the shutter in the class SHUTTER_OPENING of DET_MAIN. In the DET_MAIN.ini file, we have added the parameter nominal_open_steps = 42000, and we have updated the opening_duration to 80 seconds.

The opening and then closing of the shutter are tested with the automation on Fig.3. The closing is still performed with the MOVETOLIMIT command in order to be sure that we always start opening the shutter from the same position.

It was then possible to relock the ITF in Low Noise 3 at first trial.

Images attached to this report
AdV-DET (Commissioning)
mwas - 8:31 Thursday 18 April 2024 (64012) Print this report
Comment to An excess noise on B1_PD3 that strangely disappeared (63991)

Figure 1. Another channel that sees the noise is SDB1_B5_QD1_H (and all the other channels of the quadrants on SDB1). It sees the noise start when the slow shutter on SDB1 starts opening 15:59:16, then the noise level is constant, and the it stops. On B1 PD3 the noise level stops when it stops on B5 QD1, and it is present only when there is light on B1 PD3, so that is the reason why the level of noise on B1 PD3 varies in time during these 5 minutes.

This is most likely due to the slow shutter of the OMC which is mounted on an Agilis translation stage with electronic end of range stops. The stops are failing and the piezo-motor of the shutter keeps trying to push it further even though the translation stage arrived at the end of its range.

Figure 2. Shows that the OMC thermistor sees a line at ~1721 Hz when the slow shutter is in motion. This is likely the electrical cross-coupling of the voltage sent to the slow shutter showing up on the voltage readout used for the temperature measurement.  In blue is when the shutter moves and in purple when the shutter doesn't move. Unfortunately dataDisplay can't seem to handle the dynamic, and making an FFTtime plot of this channel doesn't seem to work.

FIgure 3. When the shutter is closing after an unlock there is also a 1721Hz line preens in OMC1 T1, but it is 10 times smaller.

Figure 4. OMC T1 also sees the 1721Hz when opening the OMC shutter in single bounce. The line stays on for about 30 minutes, before stopping by itself. The shutter is closed 20 minutes after the line stops by itself according to the shutter log file.

Action items to debug this further and mitigate it:

  • To open the OMC slow shutter use a given number of step instead of moving the shutter to the limit. The needed number of steps to open the shutter need to be tested, for example in single bounce after the next unlock.
  • Keep using the move to limit command for closing the shutter, so the shutter always goes back to the same position after a round trip.
  • Test the operation of the OMC slow shutter in single bounce. The problem can be seen on OMC1 T1 when opening the shuter. Turn on/off the driver of the slow shutter and see if that restores the functioning of the translation stage stops.
  • Investigate in past data if the shutter has started to slow down, if it takes more seconds between when the shutter command is sent and when the light appears on B1s.
  • Check if the height of 1721Hz line is constant on OMC1 T1 when the shutter is opened, or if it changes in height after a fews tens of seconds when the translation stage arrives at the stop.
  • Investigate in past data if the height of the 1721Hz line when the shutter is being opened has increased over the past months.
Images attached to this comment
Search Help
×

Warning

×